AI for SEO · Building and Scaling SEO With AI
UX & Behavioral Signals
Improve user experience to increase your rankings
Optimize for People
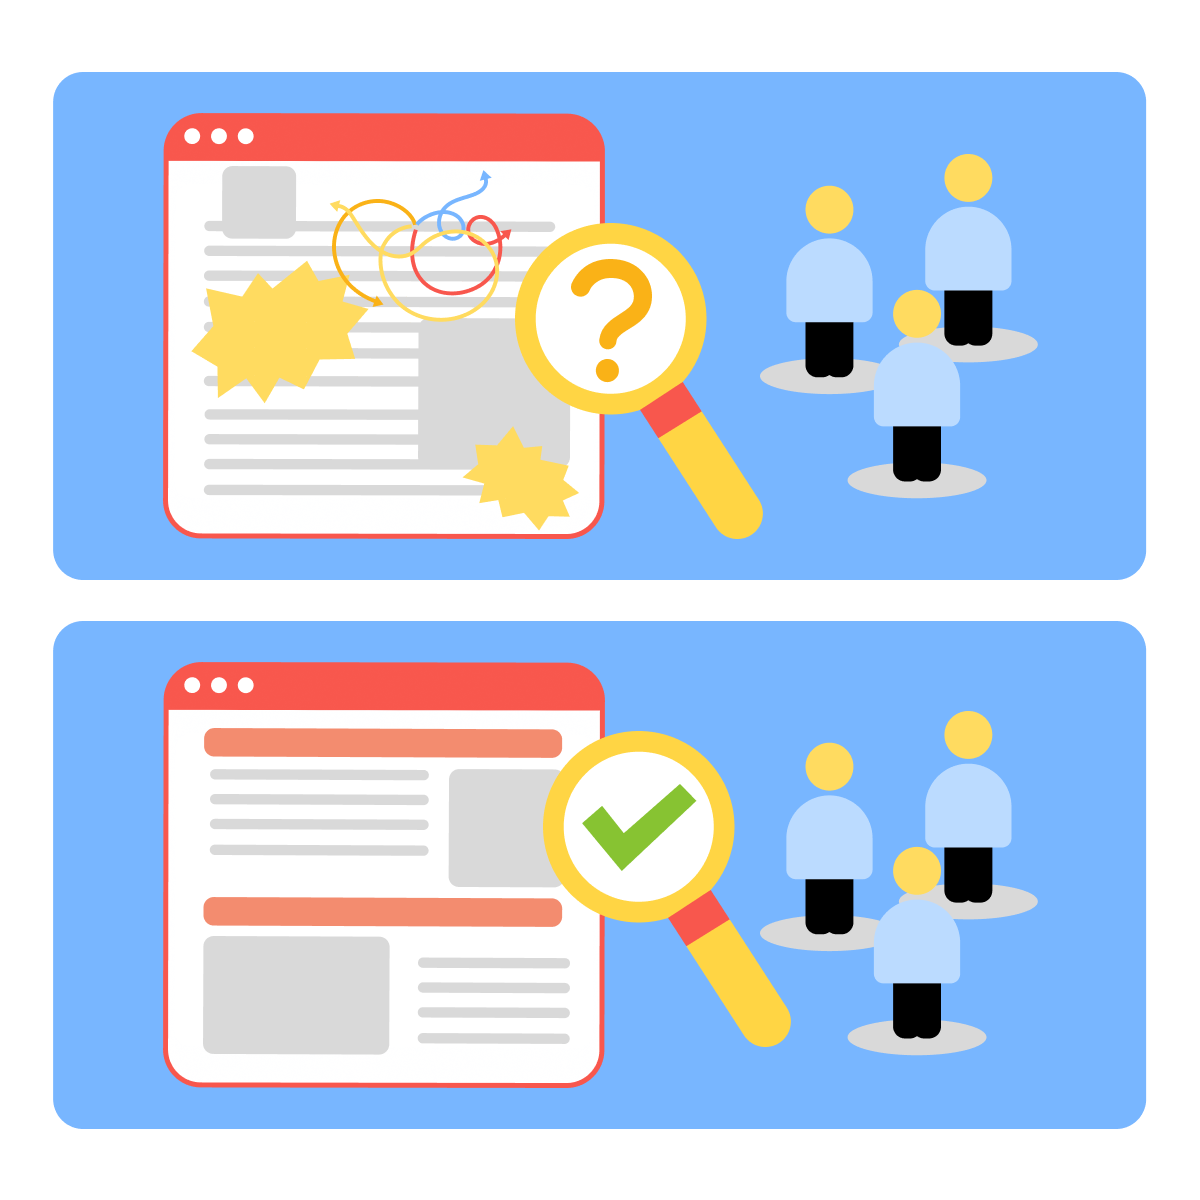
Here's the thing — you can have perfect keywords, clean technical SEO, and strong backlinks, and still lose rankings. If users hate the experience, Google notices.
In this lesson, you'll learn how user behavior affects rankings and how to optimize for real users as well as search engines.

When someone searches "minimalist bedroom ideas," clicks your result, spends four minutes reading, and clicks to other pages on your site — Google reads this as "good result, satisfied user."
When someone clicks your result, spends five seconds, and immediately returns to search, Google reads this as "bad result, user didn't find what they needed."
What Are Behavioral Signals?
That's behavioral signals. Theyare actions users take on your site that tell Google whether your page satisfies their search intent.
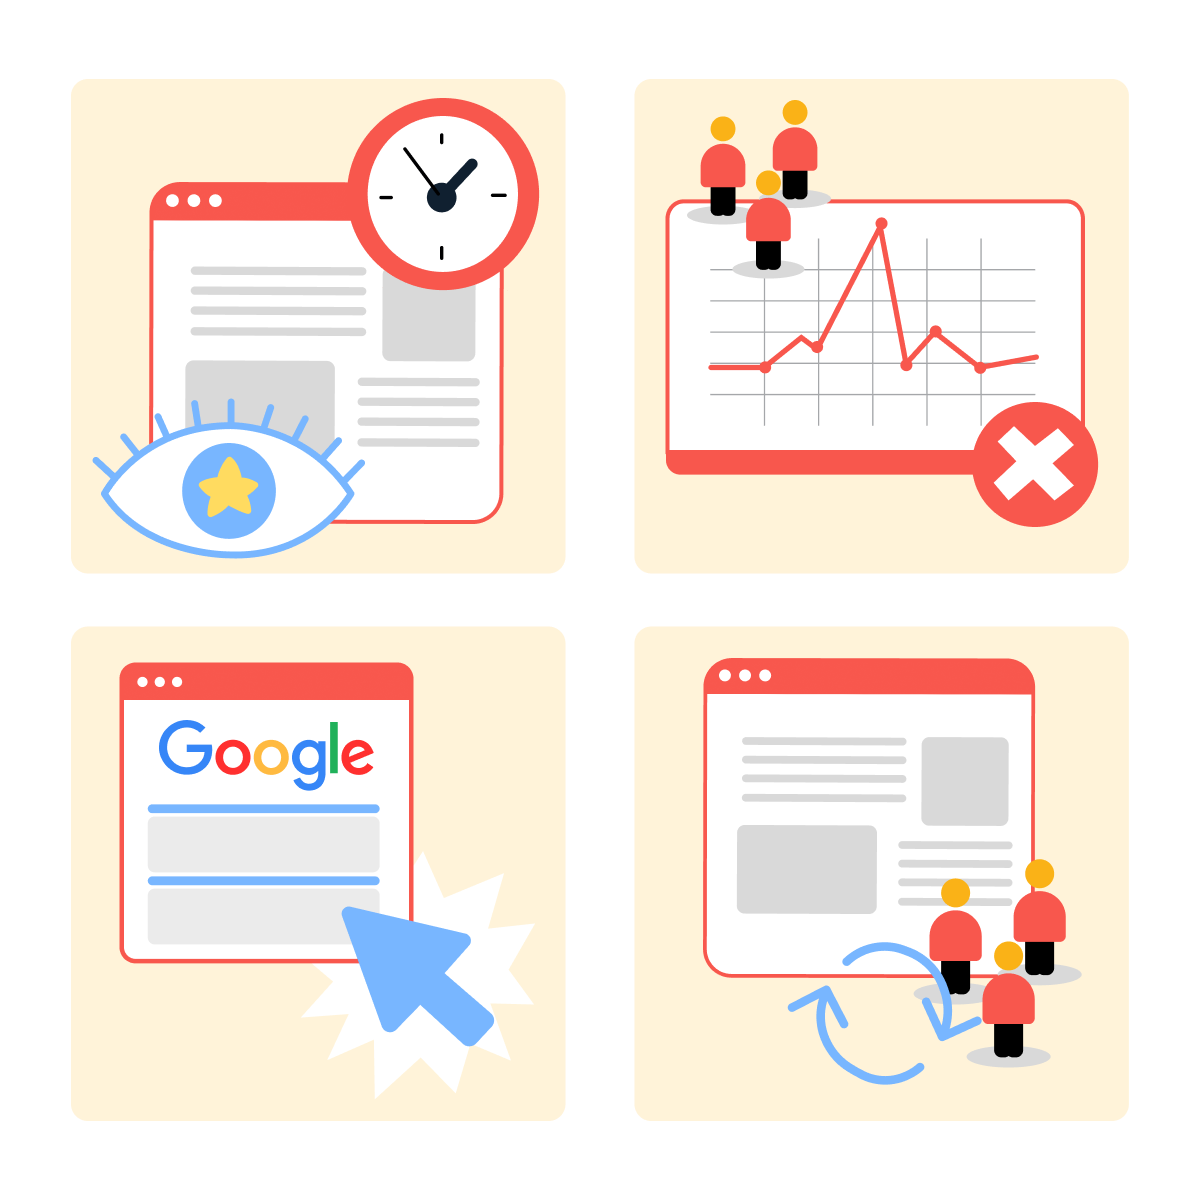
The four key user behavior patterns Google interprets:
- Time on page: how long someone stays reading your content
- Bounce rate: the percentage of visitors who leave immediately without clicking anything
- Click-through rate: how often people click on your result in search results
- Returning visitors: how many people come back to your site later
These signals show Google if users find your content valuable.
Choose one
How do behavioral signals affect SEO rankings?
For your home decor business, a visitor searches "minimalist bedroom storage ideas," clicks your result, but the page loads slowly, has tiny, unreadable text on mobile, and buries the actual storage ideas below three paragraphs of fluff.
They leave in frustration. Google sees this pattern across multiple users and drops your ranking — even if your content is technically optimized.
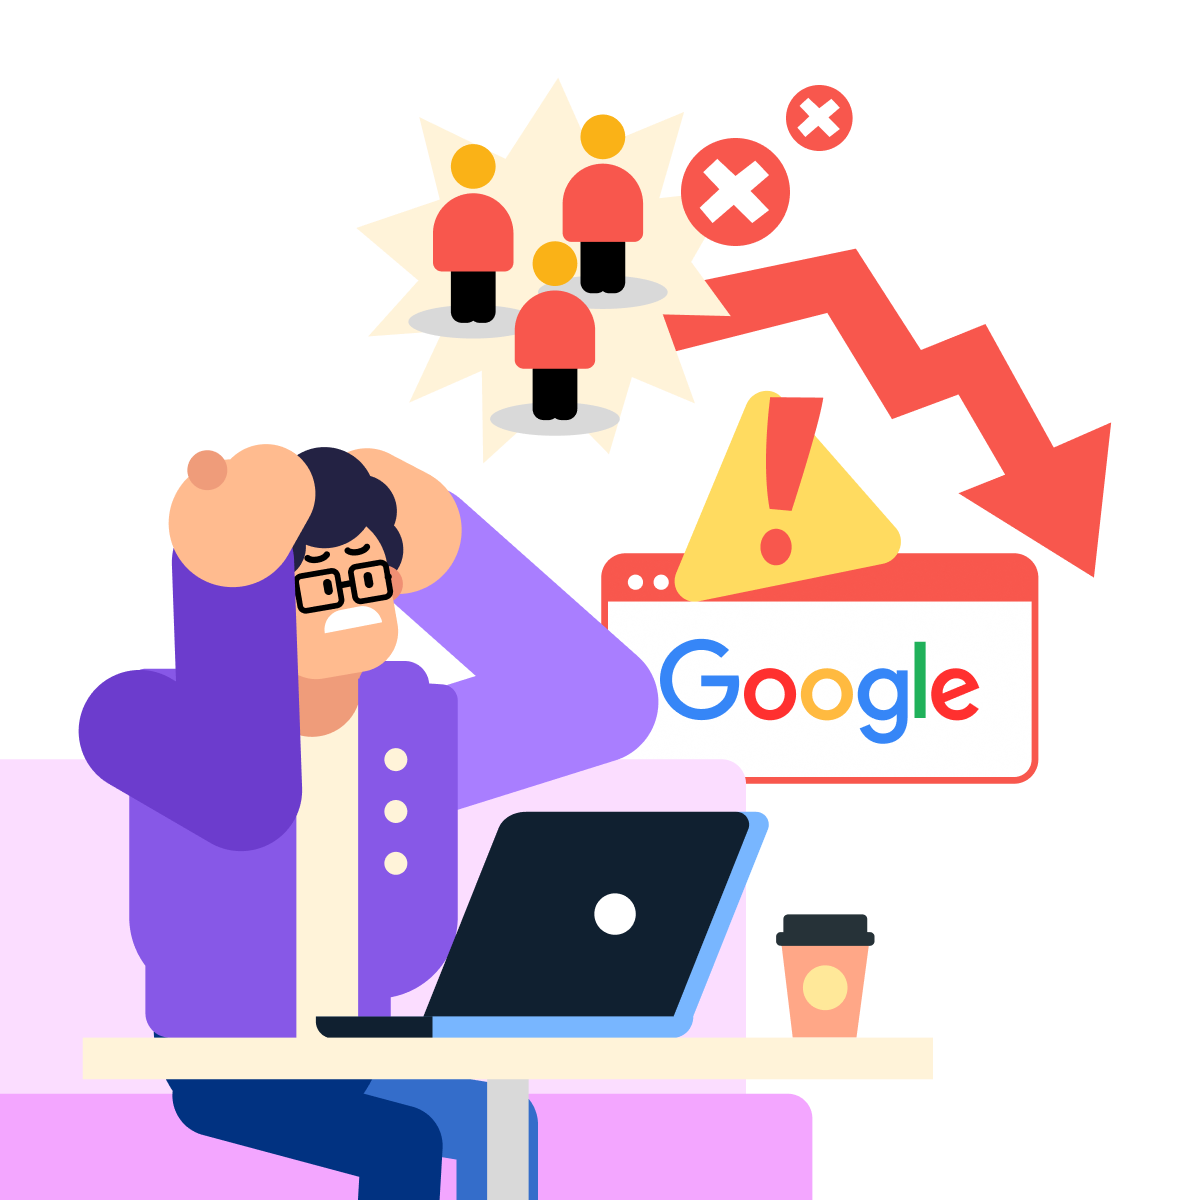
That's how poor UX damages rankings through negative behavioral signals. But which UX elements matter most for SEO?
The Three Critical UX Factors
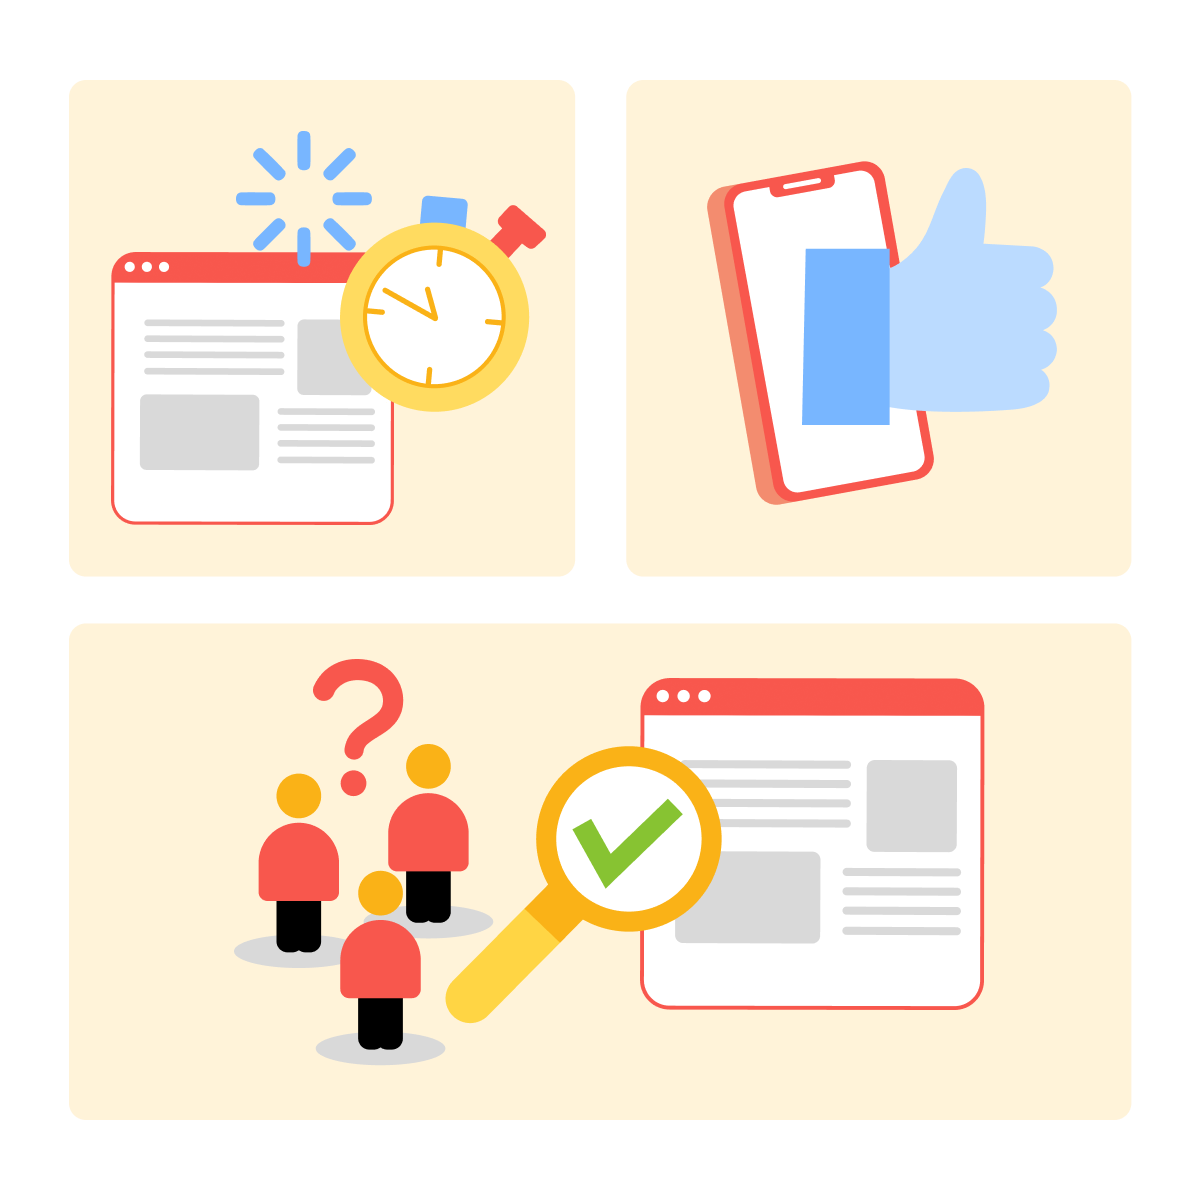
These UX elements have the biggest impact on behavioral signals:
- Page speed: how fast your page loads
- Mobile experience: how well your site works on phones
- Content accessibility: how easily users find what they need
Each one directly affects whether users stay and engage or bounce.
Let's start with Page Speed. Before analyzing your site, you need to understand what the speed metrics mean.
Think of these metrics like a restaurant experience — if the service is slow, you get frustrated and leave.
Understanding Core Web Vitals
- Largest Contentful Paint (LCP): How long until your main image appears?
- Interaction to Next Paint (INP): How long between clicking a button and something happening?
- Cumulative Layout Shift (CLS): Does content jump around while loading and make you click the wrong thing?
Choose one
What risks does a slow-loading mobile page create for your business?
Yes, but now we need a tool that measures how fast your pages load for real users. That's what Google PageSpeed Insights does.
Google PageSpeed Insights is a free tool by Google that analyzes any webpage and gives it a performance score from 0 to 100.
It measures your Core Web Vitals: LCP, INP, and CLS, and shows what's slowing your page down. And because it's built by Google, it uses the same data Google's algorithm uses to evaluate your page.
Step 1: Check Page Speed
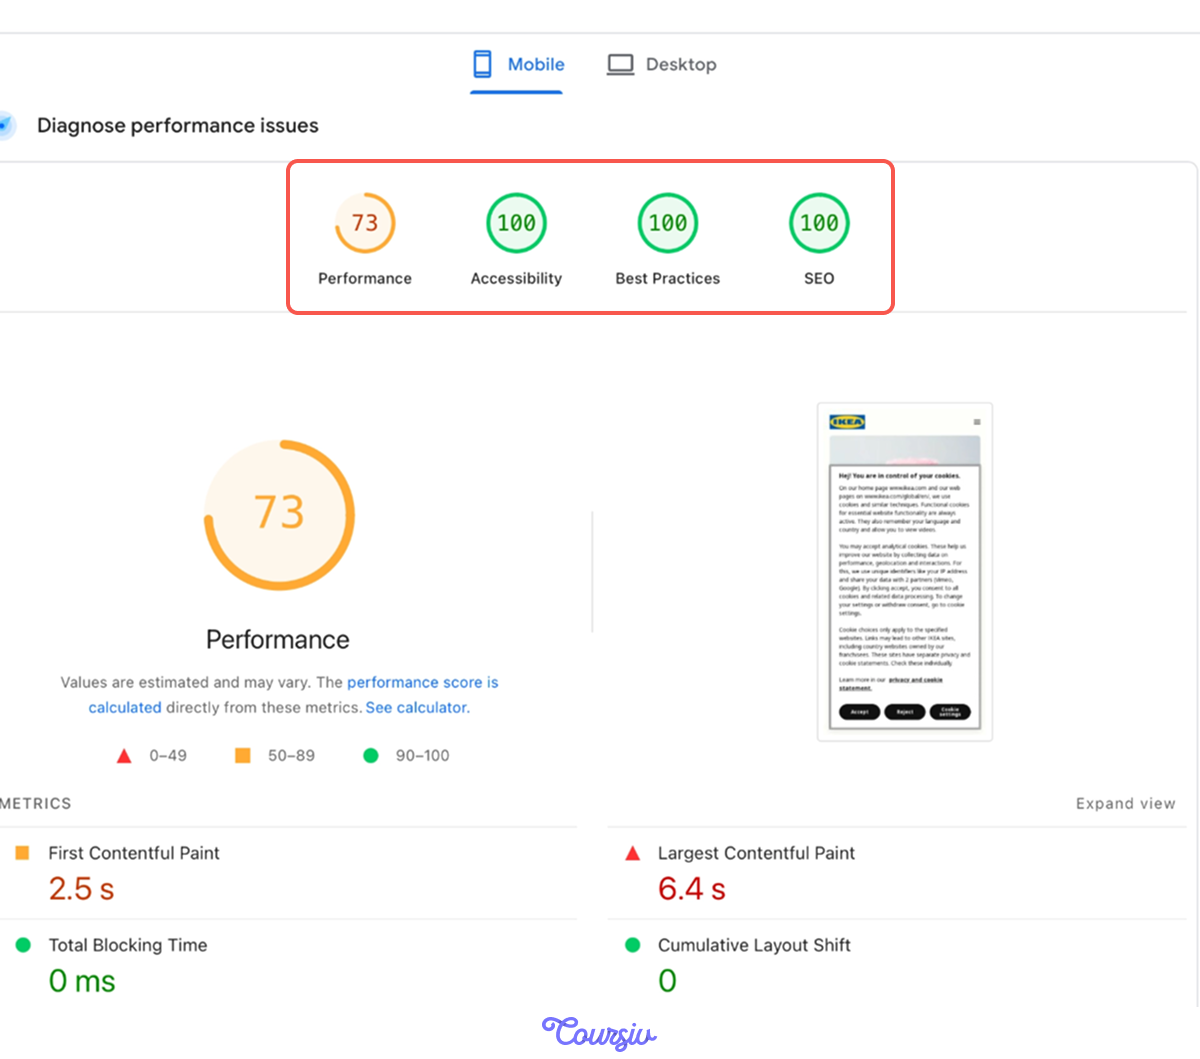
Let's see IKEA's speed. Go to Pagespeed.web.dev and enter the URL. It will show results for the Mobile and Desktop versions. Choose Mobile: this is where most users visit from. Click "Analyze."
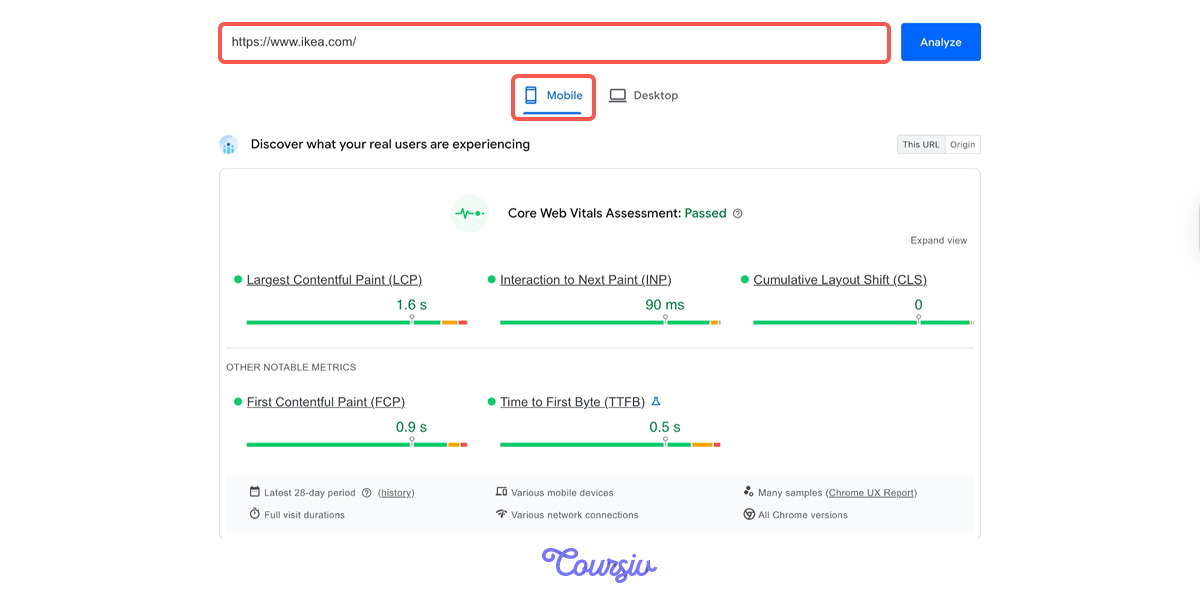
The results show overall page speed score, performance metrics (LCP, INP, CLS), and opportunities to improve.
But how do you make sense of this technical data and understand what can slow down your speed? Try copying the metrics to Gemini to analyze them.
practice preview
Interactive practice
Fill in the blank
Use Gemini to understand what the speed metrics mean and how to prevent future issues.
Great Work!
PageSpeed Insights shows what's slowing your site, and Gemini turns that data into clear action steps. Try your own URL, then a competitor's — it's a quick way to spot gaps. Now let's move to the mobile experience.

Optimizing Mobile Experience
Over 60% of searches happen on mobile devices. If your site doesn't work well on phones, you're creating negative behavioral signals for the majority of your audience.
Common mobile UX problems: text too small to read without zooming, buttons too close together (users click the wrong thing), horizontal scrolling required, and pop-ups covering content.
Step 2: Check Mobile Performance
In Google PageSpeed Insights, after choosing Mobile, you'll see four scores:
- Performance: how fast the page loads
- Accessibility: how easy it is to use for all visitors
- Best Practices: how well the page follows web standards
- SEO: how search-friendly the page is
Each score shows different problems affecting mobile users.
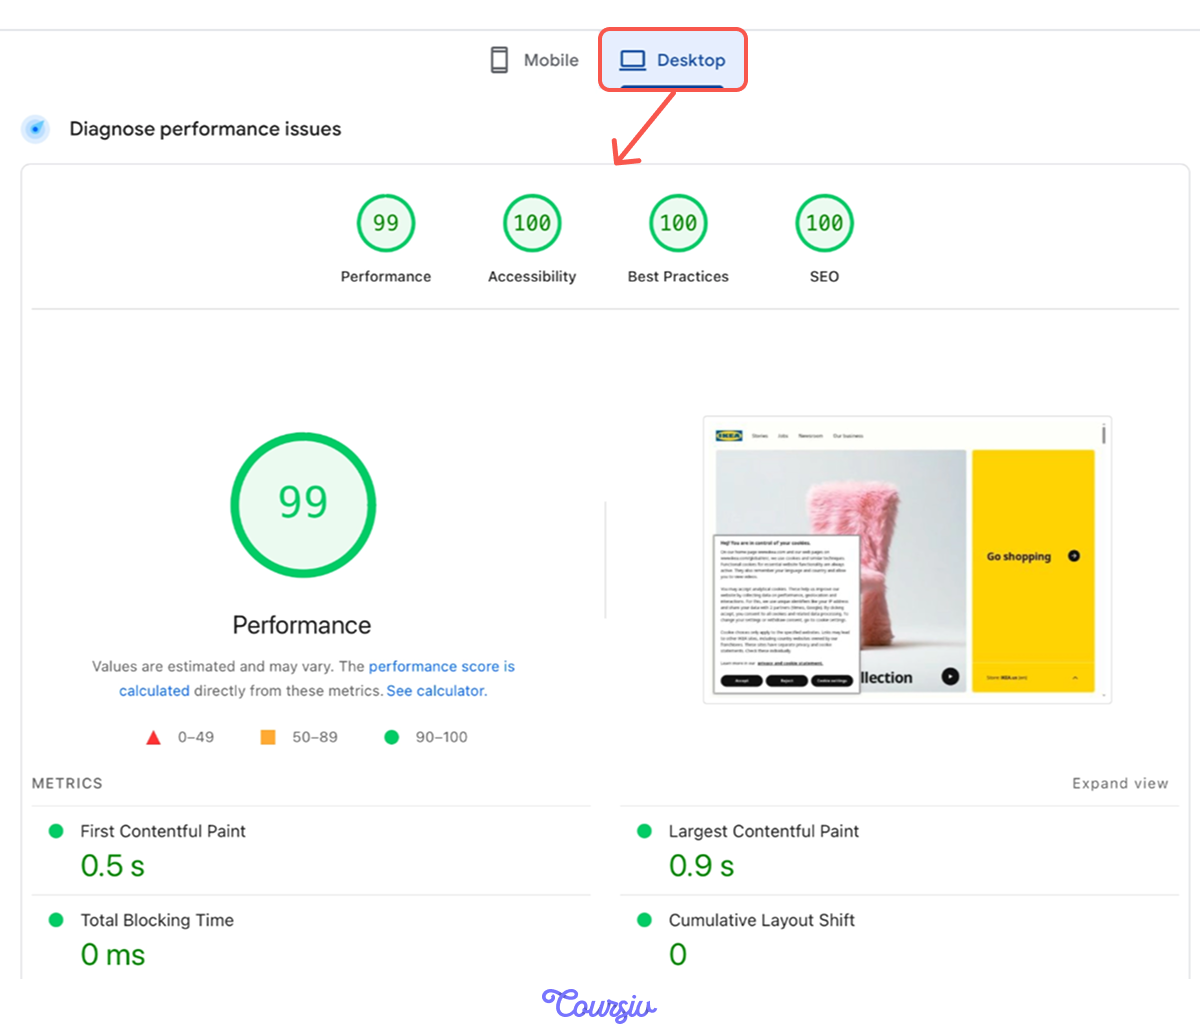
Now, what about the desktop? While most traffic comes from mobile, desktop users still matter — especially for business and research, where people spend more time comparing options.
Click "Desktop" in PageSpeed Insights to see those scores. The gap between mobile and desktop reveals where your biggest opportunities are.
Choose one
Why do you need to compare your mobile and desktop scores?
practice preview
Interactive practice
Fill in the blank
Use Gemini to understand why both versions matter.
Perfect!
You understand why mobile and desktop scores differ and why fixing mobile issues matters more — that's where most of your users are.
Optimizing both versions ensures a good experience regardless of how people access your site. Now let's tackle the third factor: content accessibility.
Making Content Easy to Find
Content accessibility means users can quickly find what they're looking for — clear headings, scannable structure, and key information visible immediately.
For "minimalist bedroom ideas," users want to see bedroom ideas right away. If they have to scroll past an intro, author bio, and ad block before seeing a single image, they'll bounce.
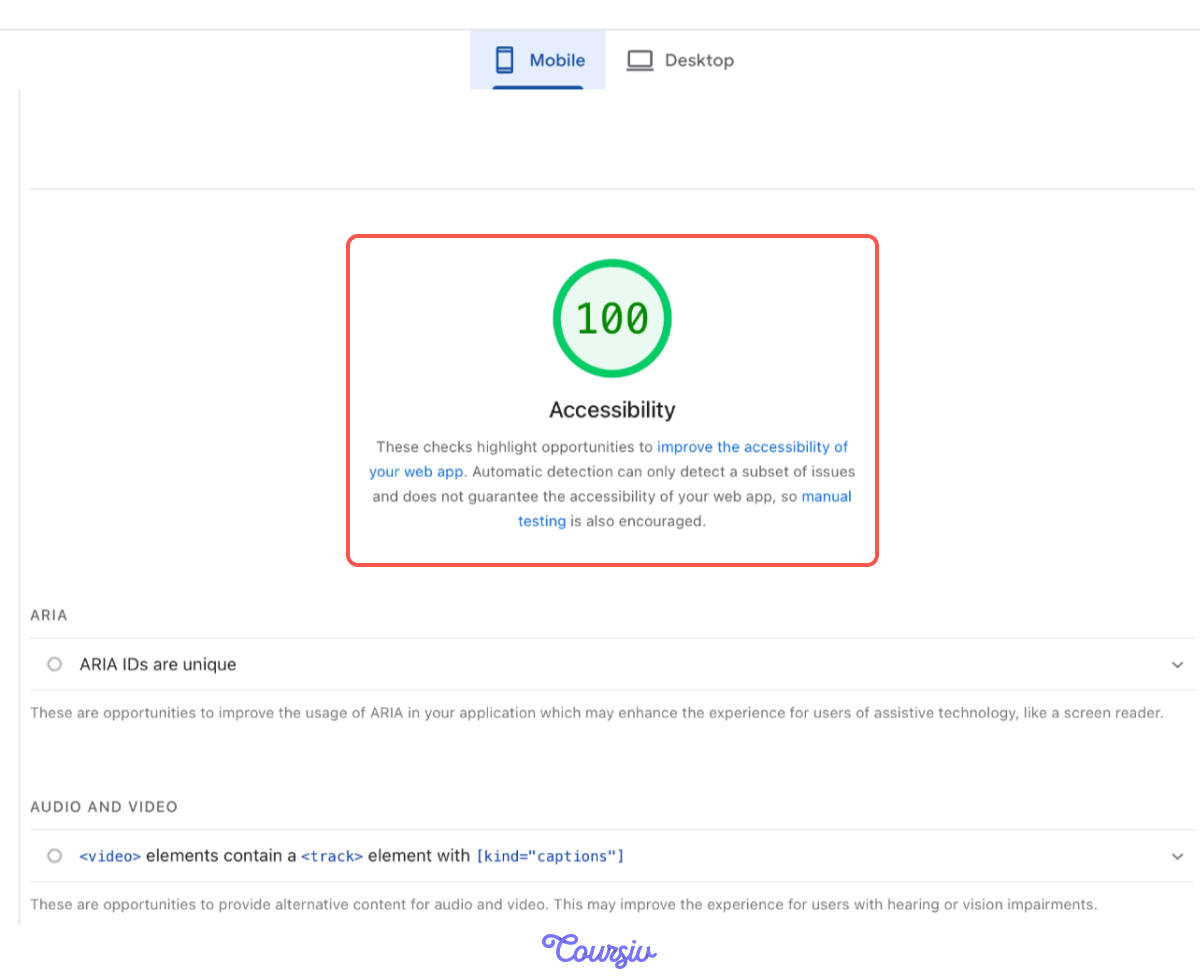
But speed isn't the only thing that matters. PageSpeed Insights also scores Accessibility — how usable your site is for everyone, including users with disabilities.
To break down that score, we'll switch to Claude, which is especially strong at explaining what technical issues mean for real users.
practice preview
Interactive practice
Fill in the blank
Use Claude to understand what the Accessibility score means from PageSpeed Insights.
Excellent!
You analyzed accessibility issues directly from PageSpeed Insights. Claude shows where your site fails accessibility standards — missing alt text, poor contrast, broken headings, and small buttons — so you can make it usable for everyone.
Select all that apply
Which UX improvements most directly improve behavioral signals and rankings?
- Behavioral signals — time on page, bounce rate, click-through rate, and returning visitors — tell Google whether your content satisfies search intent. High engagement signals quality; immediate bounces signal poor UX.
- Use Google PageSpeed Insights to measure Core Web Vitals (LCP, INP, CLS). Compare mobile and desktop scores — they often fail in different ways.
- Use Gemini to analyze speed metrics and understand what's causing slowdowns and how to fix them.
- Prioritize mobile fixes first — that's where most of your users are.
- Use Claude to break down your Accessibility score and identify what's making your site harder to use for real visitors.
Next up, we're getting local. You'll learn how to show up exactly when nearby customers are searching for what you sell — and how to make sure it's your business they find, not a competitor down the street. See you there!