AI Performance Marketing · Search and Contextual Advertising
Search Optimization
Continuous search optimization strategies
Search Optimization as a Continuous System
Welcome back to TechFlow! Your campaigns are live, and targeting is set. At this morning's marketing meeting, your CEO assigned you a task, "We've spent $2000 and got 22 conversions at $89 CPA. Build an optimization plan to get us closer to our $50 target."
In this lesson, you'll discover how search optimization works as a continuous decision loop, how to interpret performance signals versus noise, and how to prioritize actions that move TechFlow's CPA toward your $50 target.

Optimization Is a Loop, Not a Checklist
Most marketers treat optimization like a one-time audit: check settings, make changes, move on. But search optimization is an ongoing process.
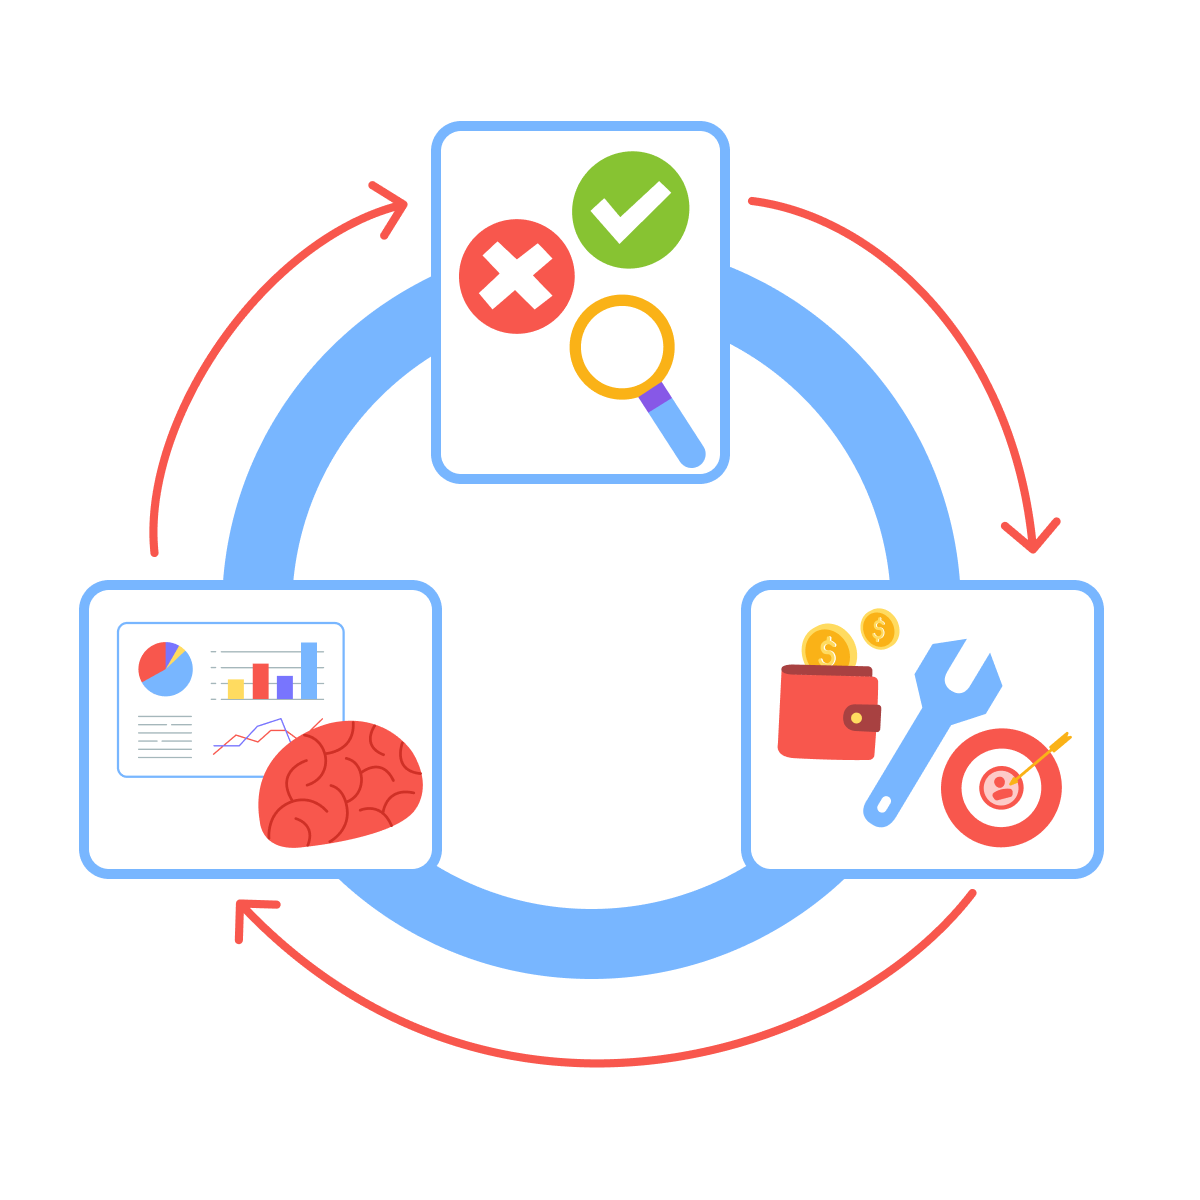
The optimization loop:
- Observe performance data.
- Diagnose what's working/failing.
- Adjust budgets/bids/targeting.
- Reassess results.
- Repeat.
Each cycle reveals new signals that inform the next cycle.
Step 1: Observe Performance Data
TechFlow's campaign generates new performance signals every day: which keywords convert, which placements waste budget, which search queries trigger your ads.
The challenge is that your dashboard shows hundreds of data points. Most of this is noise — random fluctuations that don't indicate real problems.
Signals are patterns that repeat over time and impact your core metrics (CPA, conversion rate). Without systematic observation, you're reacting to random fluctuations instead of optimizing strategically.
After two weeks of running, TechFlow's situation is as follows:
- $2000 spend, 22 conversions at $89 CPA (target is $50).
- "Marketing automation" broad match is getting the most traffic at a $180 CPA.
- "Workflow automation platform" is performing at a $42 CPA but is constrained by budget.
This data contains clear signals about what's working and what's not.
Most marketers ask AI, "What should I optimize?" without providing performance context. Let's see how to properly observe and analyze your data.

practice preview
Interactive practice
Fill in the blank
Ask ChatGPT to analyze performance data and identify key signals.
Excellent!
TechFlow now knows which keywords are wasting budget and which need more investment.
Now let's move to Step 2: Diagnose why these performance differences exist.
Step 2: Diagnose What's Working and Failing
Observation tells you what is happening. Diagnosis tells you why. TechFlow's "workflow automation platform" keyword suddenly jumped from $42 CPA to $95 CPA overnight. Most marketers panic and pause it immediately.
But diagnosis requires asking, why did this happen?
Without diagnosing the root cause, you might pause your best keyword when the real problem is one bad placement.
You've checked TechFlow's placement report in Google Ads for the "workflow automation platform" keyword. Here's what you found:
Search placement: $38 CPA (20% of spend)
YouTube placement: $220 CPA (80% of spend)
Something is clearly wrong — but what's causing the spike? Let's use ChatGPT to analyze this breakdown and identify the root cause.

practice preview
Interactive practice
Fill in the blank
Ask ChatGPT to diagnose using an actual performance breakdown.
Great Work!
So instead of pausing TechFlow's best keyword, you excluded one placement type and restored $42 CPA performance.
Now let's move to Step 3: Adjust based on what you've learned.
Step 3: Adjust Budgets
Once you've diagnosed the issue, it's time to adjust. Unskilled marketers set budgets based on assumptions and never change them despite performance signals.
Budget optimization means shifting funds from underperformers to proven winners. If one keyword delivers $42 CPA and another delivers $180 CPA, the winner should get more budget.
But how much to shift?
You've checked TechFlow's campaign performance and found that the Search campaign is generating conversions efficiently at a $50 CPA. The Display campaign is struggling with a much higher CPA of $180.
The total monthly budget is $5000, currently split between $3000 to Search and $2000 to Display. Let's use Claude to calculate the optimal budget allocation based on this performance data.

practice preview
Interactive practice
Fill in the blank
Ask Claude to recommend budget allocation based on performance.
Perfect!
You've adjusted TechFlow's budget based on performance data. By reallocating budget from Display to Search, you've shifted spending toward what's actually working — giving you more conversions at a better CPA without increasing total spend.
Now let's move to Step 4: Reassess and document your decisions.
Step 4: Reassess Results & Document Decisions
TechFlow makes 3-5 optimization changes per week. In a month, you can't remember what changed or why.
Optimization documentation tracks what you changed, why you changed it, expected impact, and actual results. This creates institutional knowledge — you learn what works for TechFlow specifically.

Most marketers don't document because it feels like extra work. But AI makes documentation instant.
Here's TechFlow's current optimization decision that needs documentation: you paused the "marketing automation" broad match keyword, which was consuming 40% of the budget at a $180 CPA, with mostly irrelevant traffic. You expect this to drop the overall CPA by $20-25 within one week. Let's create an optimization log.
practice preview
Interactive practice
Fill in the blank
Ask ChatGPT to create an optimization log entry.
Excellent!
You've documented TechFlow's optimization decision. Now let's organize all performance data in one place using Gemini in Google Sheets.
practice preview
Interactive practice
Fill in the blank
Ask Gemini to build a performance tracking table.
Excellent!
You've created a tracking table. Now let's visualize these optimization decisions using Looker Studio — Google's free data visualization platform that turns your spreadsheet into live dashboards.
Looker Studio transforms your Google Sheets data into visual dashboards that show CPA trends, budget allocation changes, and keyword performance over time.
Instead of staring at spreadsheet rows, you see line charts, tables, and annotations that reveal cause-and-effect relationships. This helps TechFlow's team understand which optimizations actually worked.

Step 1: Connect Looker Studio to Your Data
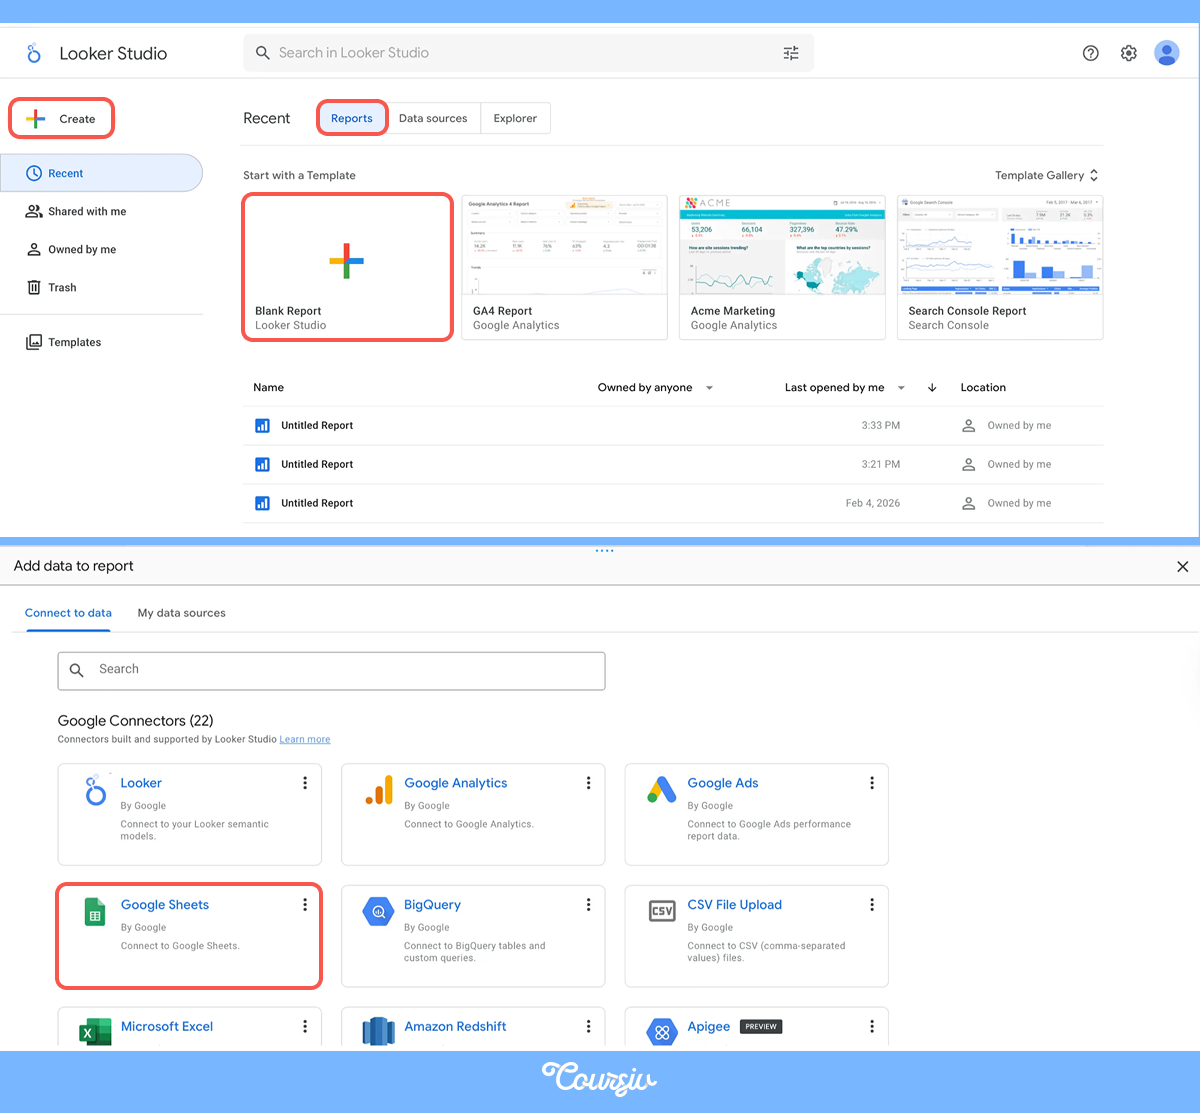
Open Looker Studio, click "Create" → "Reports" → "Blank Report." Then select "Google Sheets." Choose your TechFlow performance tracking sheet.
Looker Studio now has access to all your campaign data — impressions, clicks, conversions, CPA, and optimization notes.
Step 2: Create Charts in Looker Studio
To track TechFlow's performance:
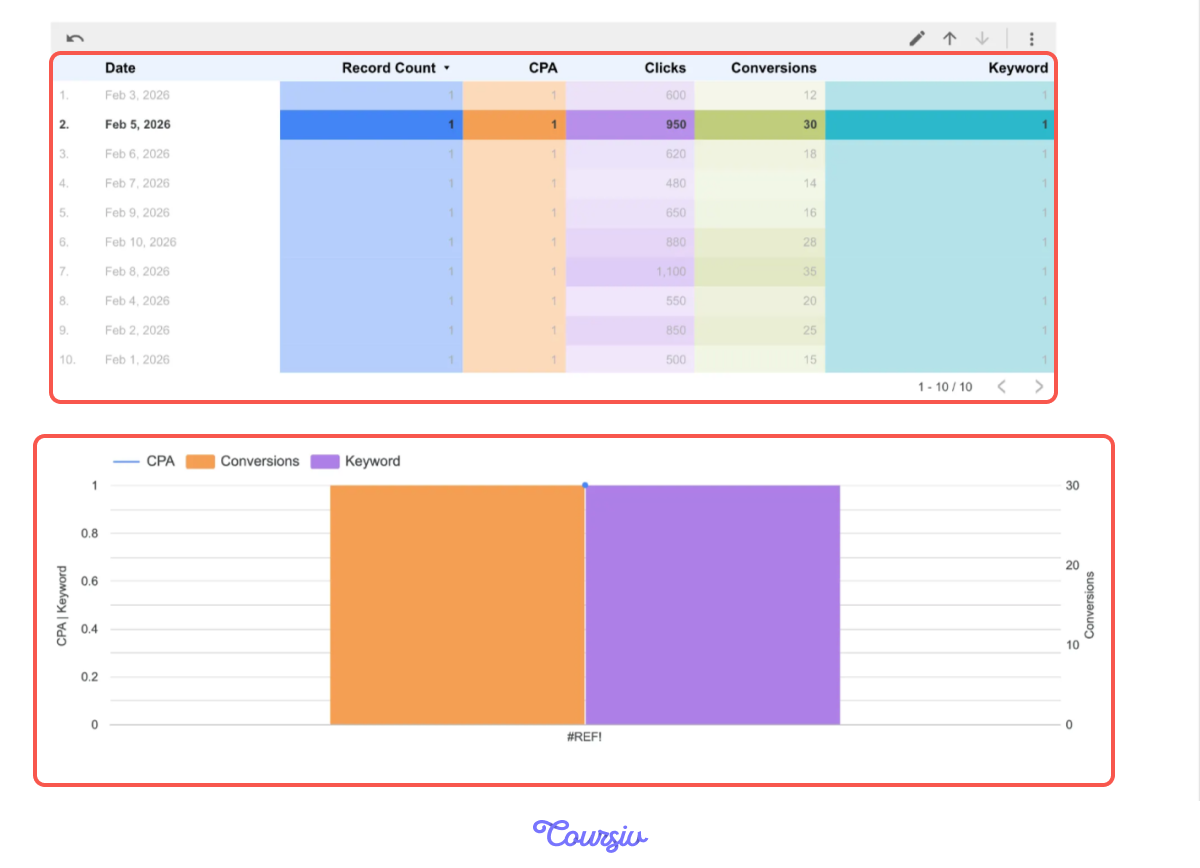
- Add a table with columns for Date, Record Count, CPA, Clicks, Conversions, and Keyword. This shows daily performance at a glance.
- Create a bar chart with Conversations and Keywords. This visualizes which keywords have high CPAs and whether they're converting.
Both charts update automatically when you add your new data to your Google Sheets tracking table.
Great Work!
You now know how to use Looker Studio to visualize TechFlow's optimization impact. Instead of manually scanning spreadsheet rows to spot trends, you can see at a glance which keywords are converting, how CPA changes over time, and whether your optimization decisions improved performance.
This closes the optimization loop.
Perfect!
You now know how to complete the full optimization loop: observe performance with data, diagnose issues, adjust budgets and targeting, reassess with documentation and visualization, then repeat.
This is what separates strategic optimizers from reactive ones — a systematic process that learns and improves over time.
- Optimization is a continuous loop: Observe data, diagnose root causes, adjust budgets and targeting, document decisions, and repeat.
- Act on signals, not noise: Random daily fluctuations don’t matter, but repeated patterns that impact CPA and conversions do.
- Shift budget toward proven performance: Reallocate spend from high-CPA underperformers to efficient keywords and placements to move closer to your CPA goal without increasing total budget.
- Reassess and document: ChatGPT logs decisions, Gemini organizes data, Looker Studio visualizes impact. Build TechFlow-specific knowledge over time.
Unit 2 Is Complete!
Good job! You've solved the CEO's challenge, TechFlow's CPA is moving toward the $50 target through systematic optimization.
In the next lesson, you'll discover how to match your message to the audience's level of awareness and design audience strategies for Meta ads.
Let's keep going together with TechFlow!