Turbocharge Your Productivity with AI · AI-Powered Productivity
Extract Key Insights from Any Text
Make sense of information overload in minutes
Make Sense of Information Chaos
You're probably drowning in information like emails, reports, data dumps, and meeting notes. But information isn't insight — raw data doesn't drive decisions.
So, in this lesson, you'll learn to make sense of this information. Let's turn noise into clarity!

From Information Overload to Clarity
Most professionals spend hours reading reports and trying to spot patterns manually. AI does this in seconds.

Choose one
What do you think is the primary value of using AI for information analysis?
Extracting Key Information
Start by having AI pull what matters from messy input — emails, huge documents, reports, meeting transcripts, anything text-based.
Let's say you receive a 45-page quarterly market analysis report that you need to review before tomorrow's strategy meeting.
You don't have much time, so you want AI to highlight the main points from this document.
ChatGPT can help you with that!
What you'll need to do is:
- Insert your document into ChatGPT.
- Ask ChatGPT to go through it.
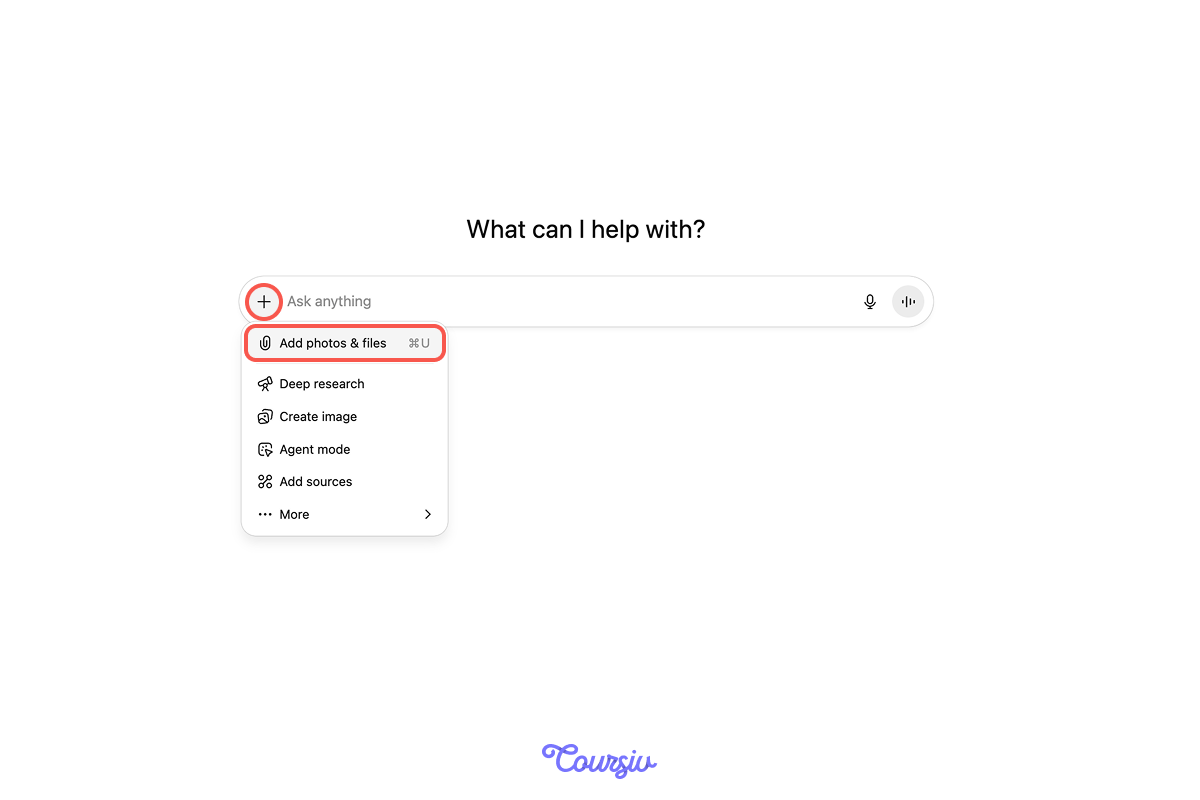
practice preview
Interactive practice
Fill in the blank
Complete this prompt to see how you can pull main points from a huge document.
Thus, AI can transform overwhelming text threads into actionable data. Using this approach, you can make decisions fast.
You can copy this prompt to your library and use it as necessary!
Categorizing and Summarizing Data
AI also excels at finding patterns across multiple data points — spotting trends you'd miss manually.

Text Example
Let's take this customer feedback analysis to summarize:
"Our latest customer survey received 847 responses across all product lines. The overall satisfaction score stands at 78%, which represents a 3-point decline from Q2. Desktop users report the highest satisfaction at 84%, while mobile users lag at 71%. The primary complaint among mobile users centers on app performance during peak hours, mentioned by 156 respondents. Feature requests dominated the feedback, with dark mode being the most requested addition (mentioned 234 times), followed by offline functionality (187 mentions) and advanced search filters (143 mentions). Support response time received mixed reviews - 62% found it acceptable, but 38% expressed frustration with wait times exceeding 24 hours. Pricing concerns appeared in 89 responses, with small business customers specifically requesting more flexible payment options. On the positive side, our onboarding process received praise from 412 users, and the new tutorial system was highlighted as particularly helpful. Integration capabilities with third-party tools were appreciated by enterprise customers, though some requested additional platform support."
practice preview
Interactive practice
Fill in the blank
Now, let's try to summarize it into five main points.
Perfect! AI found patterns across many data points that would take hours to spot manually.
Using this approach, you can categorize or summarize any text as you need. Here are some prompt templates for these purposes:
- "Organize this information into categories: [list your categories]. Include frequency count for each."
- "Group these items by: [criteria 1], [criteria 2], [criteria 3]. Present in order of priority."
- "Summarize this [document type] in [number] key points for [audience]."
- "Create a [length] summary highlighting [what to emphasize] and [what to include]."
Structuring Data for Excel
AI can also make your insights visual.
That is, just like with presentations, you can give instructions through Copilot, and AI will do its job!

Here's how to work with data in Excel using Copilot:
- Open Excel with your data or paste the text you want to analyze.
- Click the Copilot icon in the ribbon (top right).
- Give your command — tell Copilot what visualization or analysis you need.
- Review results — Copilot generates charts, pivot tables, or formatted data.
- Refine as needed — adjust colors, labels, or data ranges manually.
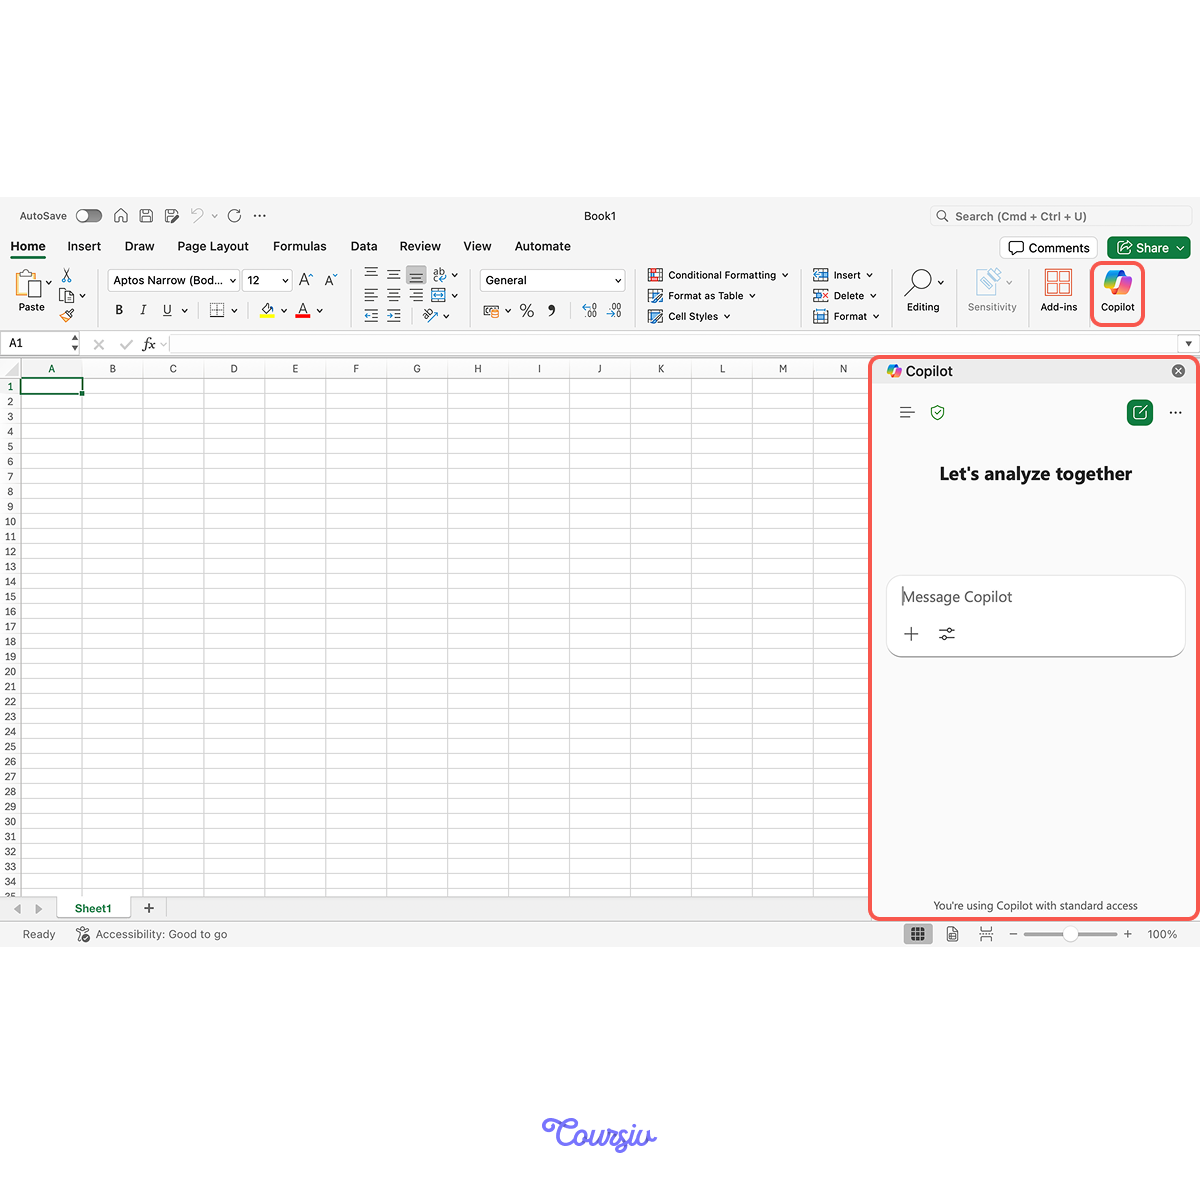
Command templates for Copilot to in Excel:
- "Present this data as a table with columns: [list columns]"
- "Create a summary suitable for Excel pivot table analysis"
- "Generate a bar chart comparing [metric] across [categories]"
- "Identify the top 5 trends in this dataset and create a visualization"
AI understands Excel's structure and formats accordingly.
practice preview
Interactive practice
True / False
Decide which output format is more useful.
practice preview
Interactive practice
Put in order
Now, arrange these steps for analyzing information with AI.
Perfect! This systematic approach transforms information overload into clear, actionable insights.
Each step adds value — extraction, structure, verification, and visualization.
Select all that apply
Last but not least, what ensures your AI-assisted analysis is actually useful?
Well Done!
You can now extract insights from messy data in minutes.
In the next lesson, you'll take it deeper — learning how to truly understand complex material, not just extract facts quickly!

- AI extracts and structures key information from unstructured text in minutes.
- You can request AI output in table formats that Excel can immediately use.
- Always verify AI-extracted data and add context from your expertise.
- Visualize insights to make patterns and priorities immediately obvious.